Every now and then my work allows me to create something both useful and beautiful. A recent project in the Flathead River in northwest Montana was just one of those moments. Our project team was performing a Channel Migration Zone (more information on CMZs at www.channelmigrationzone.com) study for the Flathead River from the Old Steel Bridge on the east side of Kalispell, downstream about 25 miles to its confluence with Flathead Lake.
One of the important, though unpredictable river processes for all rivers is avulsion, or the tendency for a river to jump out of its channel and occupy a wholly new channel. Sometimes this results in entirely new channels cut through the landscape, but more often it happens when the river either cuts off an existing bendway or hops over into a historic channel location. One technique we use to assess where these channel relocations may happen is called Inundation Modeling.
While we’ve seen Inundation Modeling used in association with complex floodplain modeling, at my company (DTM Consulting, Inc.), we have developed a rapid methodology to do this modeling using common GIS tools. It allows for a great visualization tool for rivers and river systems. Essentially it is like filling up a bathtub with water. As the water level rises, more area gets inundated. Take a look at recent flooding on the Mississippi River and you will see what I mean. The challenge for us is to account for the constantly-changing slope of the river as we create the model. Our methodology uses defined cross-section locations to control for the slope of the river, allowing us to normalize the landscape to a common base elevation.
The image below is shows the entire project area. Kalispell is in the upper left corner of the image (you can see some linear features that represent roads, bridges, etc.) and the river meanders downstream to the Lake in the bottom right. The blue line represents the modern river bank full channel location.
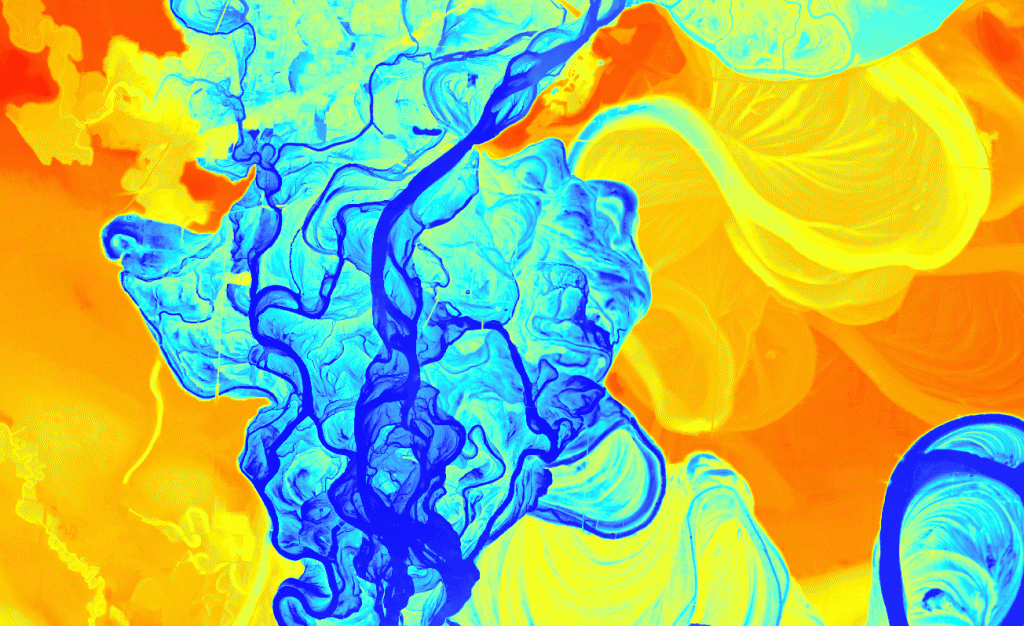
In the image, reds and oranges represent areas that are either existing water, or generally at the same elevation as the river (e.g. wet or potentially wet during a flood). As you progress to yellows, greens, then blues, you are getting higher and higher above the level of the river (e.g. drier in a flood situation). You can clearly see the old swales and locations were the river used to flow. These are the areas were we might expect to see the channel avulse and occupy. Note, the stars really have to be aligned for this to occur, especially on this system. More likely on the Flathead would be avulsions due to meander cutoff. Several of these are visible in the image, as well as locations where it might happen in the future if bankline migration continues.
The following image is from the same model, but is in the braided channel section at the upper end of the study area. Also, the color ramp has been reversed, so now reds are the high spots and blues are low. (Just trying to keep you all on your toes!).
1 Comment
-
Coolness! (:


