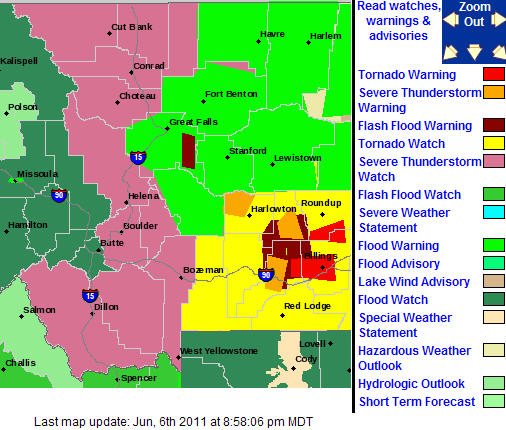
Is it just me, or is the weather getting a little bit wacky? Here is yesterday’s NOAA weather map from the Great Falls office. An impressive patchwork quilt of colors representing just about every nasty bit of weather that spring time can throw out us. What you don’t see is that every area actually has multiple warnings. Only the most severe and immediate are shown on the map. Tornados in Billings. Flood Warnings, Watches, and Advisories everywhere. Severe Thunderstorms. Lion and Tigers and Bears, Oh My!
But while the thunderstorms are expected, and we do get a occassional tornado wandering through the area (last year the Metro Park Arena event center in Billings had its roof torn off by a tornado), the real story is the water.
Already, central and eastern Montana have seen record rain fall. Billings, Miles City, Roundup and other areas experienced two consecutive storm cycles that dumped over nine inches of water in a couple of days. All of this flowing downhill into the Yellowstone, Big Horn, Little Bighorn, Musselshell, Powder, and Tongue Rivers, plus a number of smaller streams such as Pryor Creek. These are record floods. An associate, Chris Boyer of Kestrel Arial in Bozeman, Montana is documenting the floods and their impacts (http://www.kestrelaerial.com/). It’s worth checking out.
But we still are not at the real story. This lies in the snowpack that is still sitting up in the mountains across Montana. We’ve been tracking this for months. There is hardly a basin in Montana that does not have some degree of historic snowpack. A cooler and wetter than average spring has continued to add snow in the upper and mid-elevations. Peak runoff for our area is usually mid-June, about now. But we are just starting to see the first real runoff of the season.
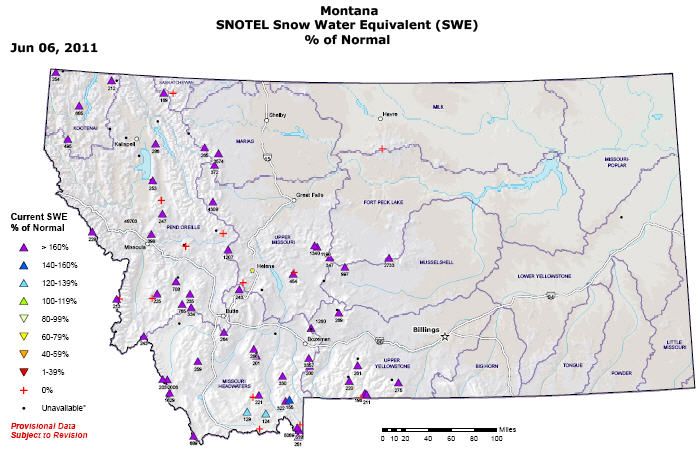
The map below shows the Snow Water Equivalent (SWE) for all of the SNOWTEL sites in Montana as of June 6, 2011. SWE is the amount of water you have in a column if the snow if that column of snow all melts. Light, low-density snow has a lower SWE than wet, dense snow. So this map shows that every basin in Montana is still well above normal for this time of year, with most of the sites exceeding 160% of normal. Even more remarkable about this map is that a decent number of these sites are in the 6,000′ to 8,000′ range, elevations that are often either snow-free or mostly snow-free by this time of year.
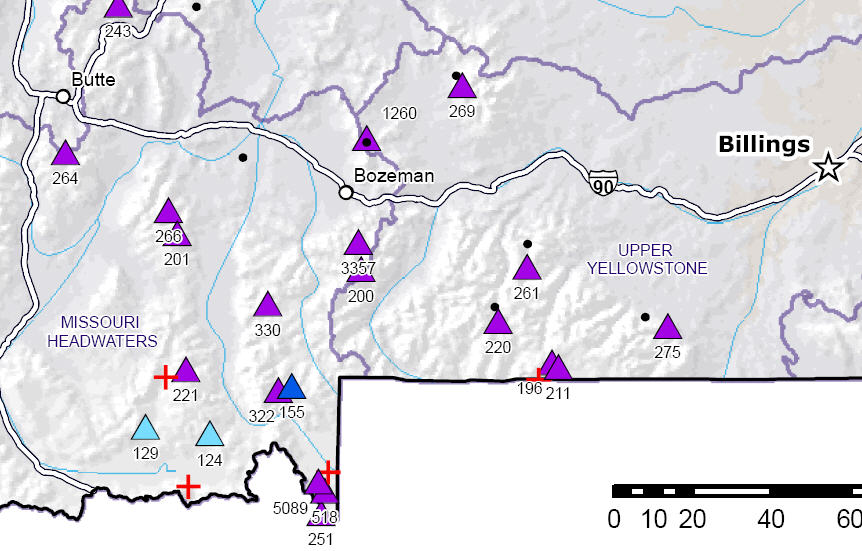
Zooming into on the Bozeman area, most sites are 200+ percent of normal! Some of the outrageous values such as the 3357% Normal just south of Bozeman indicate sites that should normally have a few inches of snow still on the ground, but still has five plus feet. All of that water has to come down the rivers sometime. And this has people very nervous.
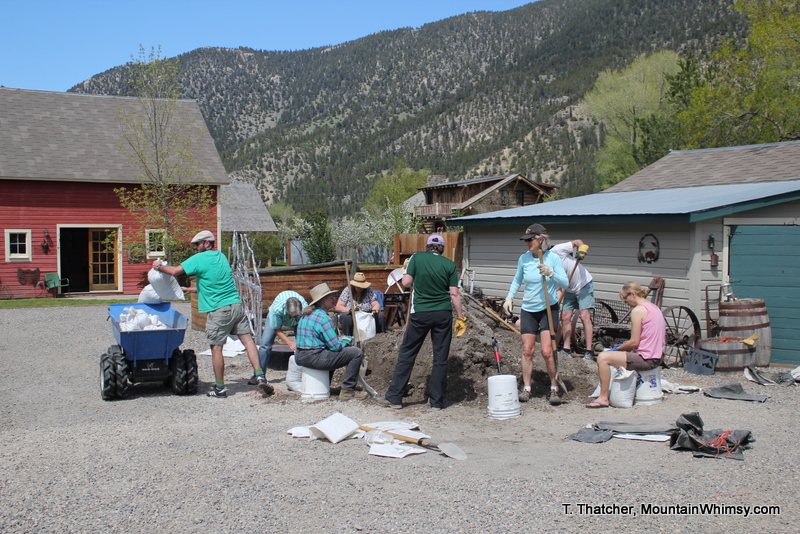
So when a friend calls and invites you to a ‘Party on the River’ this time of year, you’d better bring gloves and a bottle of ibuprofen. Sandbagging is the price you pay for the chips and beer.
1 Comment
-
Dang. Weird to think of that much snow in June. Is it still below freezing up there?
